Volatility from Jobs?
Last week, we experienced a “once in a few years” market event. This kind of stock market volatility has happened from time-to-time: 2015, 2018 and 2022 are some recent examples. The decline was very swift. The concern was that global financial markets could swoon into more a significant drop (i.e. 1987, 2000-02 and 2008). Generally, financial market participants consider a top to bottom drop of 10% a “correction”, and a top to bottom drop of more than 20% a “bear” market. In this latest market event, major equity markets behaved quite differently.
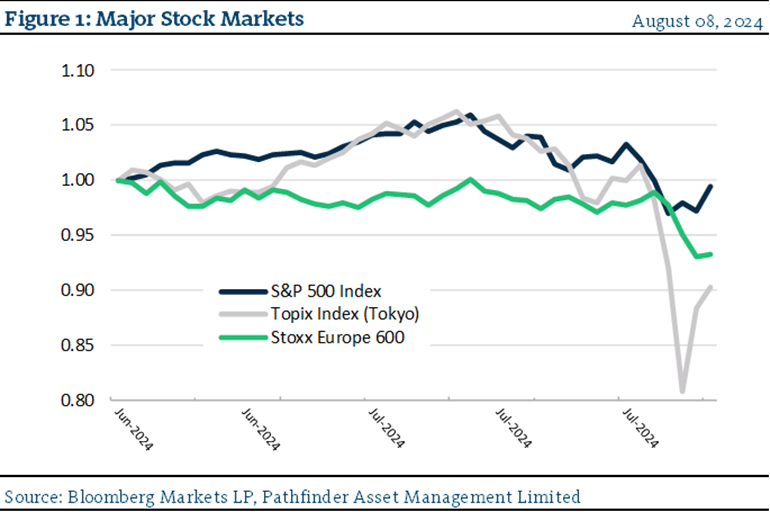
- Figure 1 presents the US, Europe and Japanese stock markets over the past three months.

- The financial press identified employment related data starting last week that drove the drawdown. On Thursday, Weekly Jobless Claims missed; however, they often miss (they’re weekly!) so we found this reasoning strange. On Friday, the press highlighted a poor jobs report. This apparently led recession worries higher. By Monday, there were calls for an emergency rate cut. In our view, the jobs data was benign and should not have caused any reaction. Also, the FOMC had met the Wednesday before and would have seen this data and made quick adjustments if they were concerned.
- On the other side of the world, Japan dropped the most (top to bottom -24.3% over the past month) after the central bank there raised administered rates and the Japanese Yen strengthened materially. This caused extremely large, leveraged trades that many hedge funds had in place to Other risk assets from around the world in other leveraged strategies had to be sold as well. We think that this small contagion is the most likely reason, not the employment market. We also note that the Bank of Japan has now walked back it’s hawkish commentary and that, in general, stability has returned to markets. We’ll see if it stays.
- The US, by comparison, had an ugly Monday morning and dropped 8.5% from their highs (not a technical correction). It has basically ended where it started 3 months ago (see Figure 1 blue line). Europe also had a market drop (down -9.8%) but again not even technically a correction, although very close.
“This means that” we think large investors pushed markets to far with leverage and concentrated volatility trades. After running so hard, a pull back should be expected and is probably healthy (although a bit uncomfortable). We don’t think the employment data puts us any closer to a recession. The US economy, while slowing, is still growing.
National Instrument 31-103 requires registered firms to disclose information that a reasonable investor would expect to know, including any material conflicts with the firm or its representatives. Doug Johnson and/or Pathfinder Asset Management Limited are an insider of companies periodically mentioned in this report. Please visit www.paml.ca for full disclosures.
Changes in Leverage. We are increasing the asset ceiling to 2.0 times the market value of equity for Pathfinder International Fund and Pathfinder Conviction Fund to be consistent with Pathfinder Partners’ Fund and Pathfinder Resource Fund.
*All returns are time weighted and net of investment management fees. Returns from the Pathfinder Partners’ Fund and Partners’ Real Return Plus Fund are presented based on the masters series of each fund. The Pathfinder Core: Equity Portfolio and The Pathfinder Core: High Income Portfolio are live accounts. These are actual accounts owned by the Pathfinder Chairman (Equity) and client (High Income) which contain no legacy positions, cash flows or other Pathfinder investment mandates or products. Monthly inception dates for each fund and portfolio are as follows: Pathfinder Core: Equity Portfolio (January 2011), Pathfinder Core: High Income Portfolio (October 2012) Partners’ Fund (April 2011), Partners’ Real Return Plus Fund (April, 2013), and Partners’ Core Plus Fund (November 2014).
Pathfinder Asset Management Limited (PAML) and its affiliates may collectively beneficially own in excess of 10% of one or more classes of the issued and outstanding equity securities mentioned in this newsletter. This publication is intended only to convey information. It is not to be construed as an investment guide or as an offer or solicitation of an offer to buy or sell any of the securities mentioned in it. The author has taken all usual and reasonable precautions to determine that the information contained in this publication has been obtained from sources believed to be reliable and that the procedures used to summarize and analyze such information are based on approved practices and principles in the investment industry. However, the market forces underlying investment value are subject to sudden and dramatic changes and data availability varies from one moment to the next. Consequently, neither the author nor PAML can make any warranty as to the accuracy or completeness of information, analysis or views contained in this publication or their usefulness or suitability in any particular circumstance. You should not undertake any investment or portfolio assessment or other transaction on the basis of this publication, but should first consult your portfolio manager, who can assess all relevant particulars of any proposed investment or transaction. PAML and the author accept no liability of any kind whatsoever or any damages or losses incurred by you as a result of reliance upon or use of this publication.